
01
/Inside the project
Measure the foot
Start with the pressure under the foot.
Pressure data becomes a design through the participant.
A pressure map shows where the foot carries load. The participant helps explain what support feels right. This study connects those insights to an adjustable insole and a printed prototype.
MEASURE → INTERPRET → SHAPE → PRINT
Measure standing and walking
The team used a XENSOR PRO V8 pressure mat at TU Delft. The report describes 30-second standing trials and 10 walking cycles. These activities capture different loading patterns.
30 seconds / 10 cycles
Standing trial / Walking collection
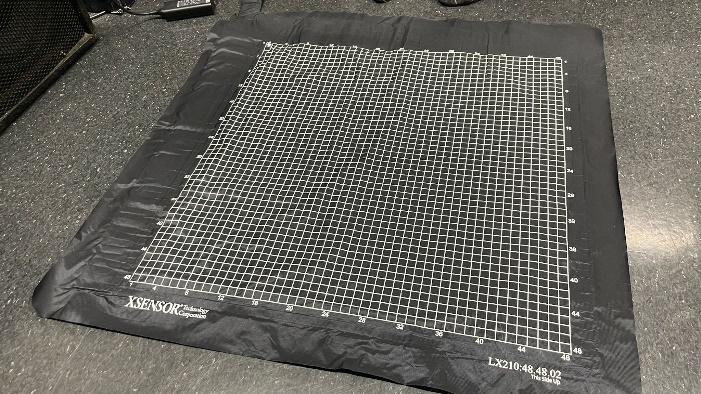
Pressure mat / TU Delft collection setup
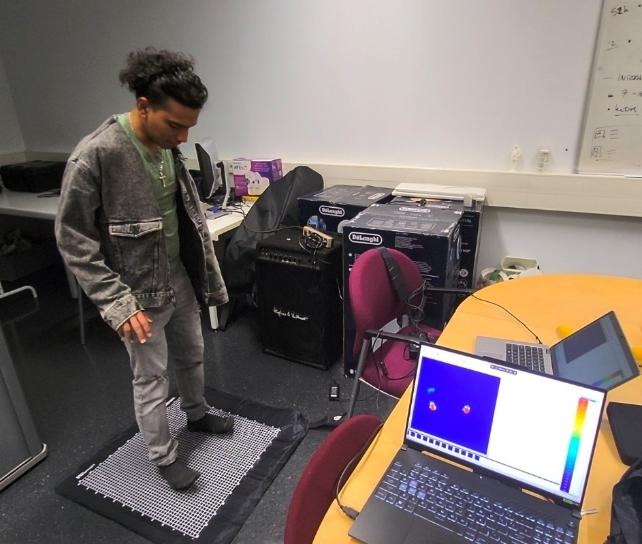
Data collection / Subject 1

Data collection / Subject 2
01 / Clean
Use Savitzky–Golay filtering to reduce sensor noise. Check sensor calibration and remove outliers.
02 / Align
Express pressure as a share of body weight. Use heel-strike detection to align the walking cycles.
03 / Find patterns
Use principal component analysis (PCA) to find patterns in the data. Compare the standing and walking results.
02
/Inside the project
Read the patterns together
Use the pressure maps to discuss support, movement, and comfort.
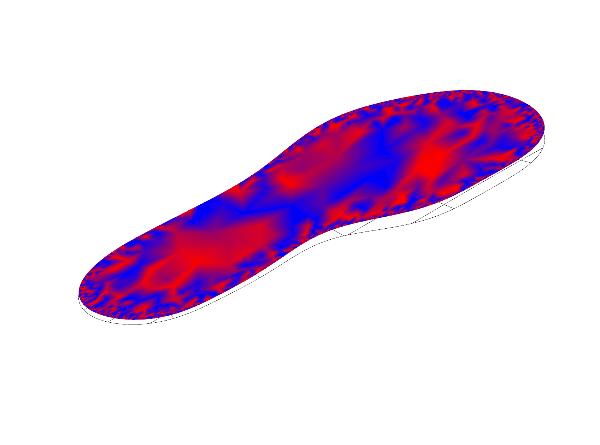
01 / Read the pressure pattern
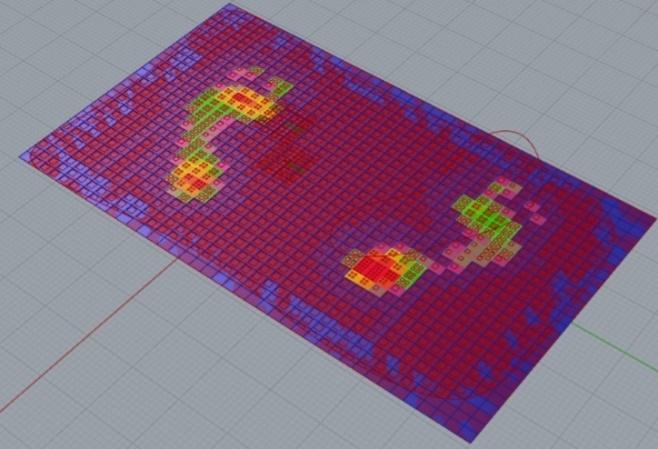
02 / Explore material distribution
See how the load changes
Standing and walking show different patterns. The phase view helps explain how the load moves across the foot.

Pressure phase view / Original XENSOR image
From a pressure pattern to a design choice
PRESSURE
Arch loading
PARTICIPANT
Support that adapts to weight shifts
DESIGN
Adjustable arch geometry
PRESSURE
Lateral push-off
PARTICIPANT
A gradual change in width
DESIGN
Smooth lateral flare
PRESSURE
Heel impact
PARTICIPANT
Cushioning with stability
DESIGN
Softer insert / Proposed, not made
The participant helps interpret the map
One participant, aged 23 with neutral arches, adjusted visualization controls and marked pressure areas. The interview connected his experience to support, cushioning, and stability preferences.
20 min
Guided exploration
25 min
Interview
03
/Inside the project
Shape and print the insole
Turn the pressure patterns and participant feedback into an adjustable model.
64×64 → 16×16
Resample the sensor grid
Map normalized values from 0 to 1 to the model.
4–8 mm
Adjust arch support
The stated adjustment range in the model.
8–12 mm
Shape the lateral flare
Use a smooth curve to change the width.
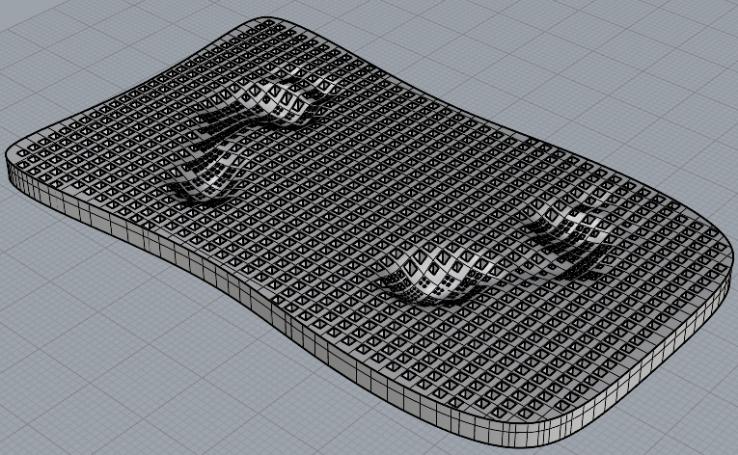
01 / Generate the pressure-informed surface
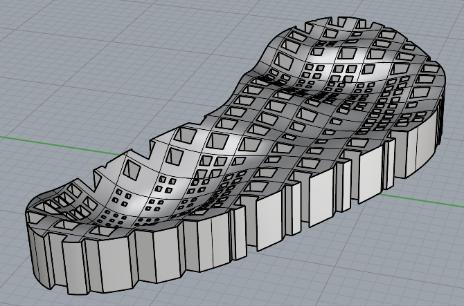
02 / Trim the surface to the foot outline
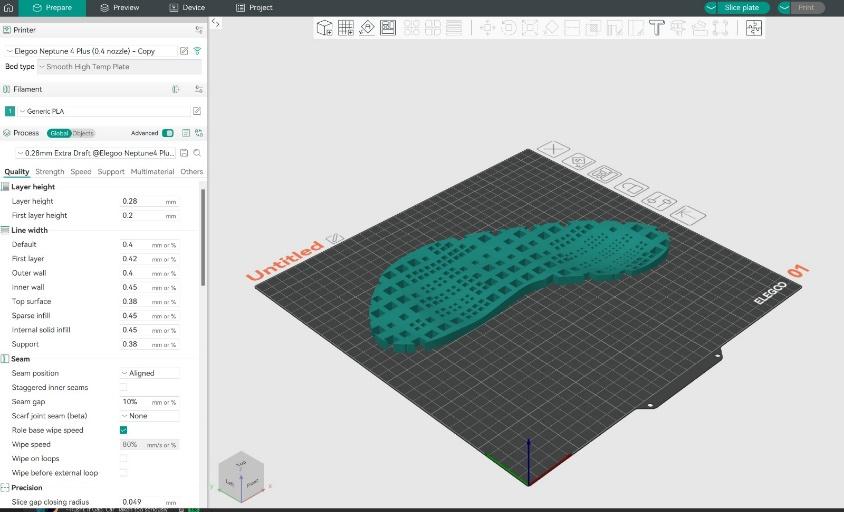
03 / Prepare the print
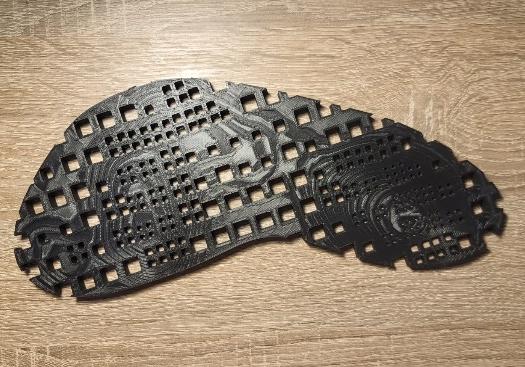
04 / The printed insole
04
/Inside the project
What the prototype shows
A physical prototype connects the data to a design. Further use tests are needed.

Initial participant check / Standing prototype
Bring the prototype back to the participant
The final model was developed for participant A in standing. The team printed the insole and tried it with the participant.
The report records satisfaction with the result. It does not provide measured comfort or performance results. Walking data informed the study, but walking performance was not validated.
A physical link between data and personal experience.
What we made
The team connected pressure measurements, participant feedback, and parametric design in one process. The result was an adjustable insole model and a printed prototype for standing.
What needs testing
Test the insole with more participants during walking and other activities. Check comfort, shoe compatibility, and material durability. Further work can apply the method to other body regions.